Before You Re-Enroll: What Your State's Degree Completion Numbers Really Say
Learn what record-degree headlines hide and which on-ramps help adults finish

Key Points
- Georgia's record 86,660 degrees measure volume, not completion rates.
- Federal IPEDS graduation rates track only first-time, full-time students.
- The Clearinghouse counts 37.6 million working-age adults with credit, no credential.
Why a Record Degree Count Isn't the Number You Need Before Re-Enrolling
Georgia's University System awarded a record 86,660 degrees in fiscal year 2026. For a returning adult, that figure tells you little about your own odds. A record degree count can coexist with a flat completion rate, because more enrolled students produce more graduates even when the share who finish does not move.
The better question is whether a state turns re-enrollment into a credential and a paycheck. Gordon State College shows how: a bachelor's degree under $20,000 in total tuition, a teaching apprenticeship that pays while you train, and nursing aid tied to hospital employment after licensure. A record degree count without those economics is just a press release total.
Georgia's 86,660 Degrees: What Completion Growth Measures and What It Hides
State headlines about record degree counts are now routine, and they are easy to misread as proof that adults are finishing at higher rates. Georgia's is a good example. The University System of Georgia (USG), which includes 25 public colleges and universities, conferred a record 86,660 degrees in fiscal year 2026, up 4.9% from the year before, according to USG's release and a Barnesville.com report on Gordon State College's results.
The 58% Figure in Context
USG also points out that degrees awarded have risen 58% since the system joined Complete College America in 2011. Over that same stretch, enrollment grew 20.2%, so output outpaced enrollment. That is a real gain in productivity. It is still a system-wide tally of degrees conferred, not an adult-learner completion rate.
The FY2026 total splits into 55,699 undergraduate degrees (up 3.6%) and 30,961 graduate and professional degrees (up 7.3%). Graduate degrees grew faster, which means a share of the headline growth sits outside the bachelor's and associate pathways most returning students are weighing.
What a Count Cannot Show
USG's release does not break the total down by recipient age, so you cannot tell how many of those degrees went to adult learners. A raw count also leaves out several things that matter before you re-enroll:
- Age mix: Traditional-age graduates and returning adults are counted the same way.
- Enrollment status: Part-time and full-time students are blended together, though they finish on very different timelines.
- Transfer-ins: A degree earned after transferring credits looks identical to one earned from a first-day start.
- Credential level: Certificates, associate, bachelor's and graduate degrees all land in one total unless the source separates them.
- Cohort size: A count does not say how many students started, so it cannot tell you how many did not finish.
USG does run adult-learner initiatives, including a 17-campus Adult Learning Consortium, but that is a program network, not a published outcome for adults.
A Sentence Worth Reusing
Growth in degrees awarded is a volume measure; completion rate is the share of a defined starting group who finish. Keep that distinction in mind whenever a school or state quotes a record number, and ask which of the two you are being shown.
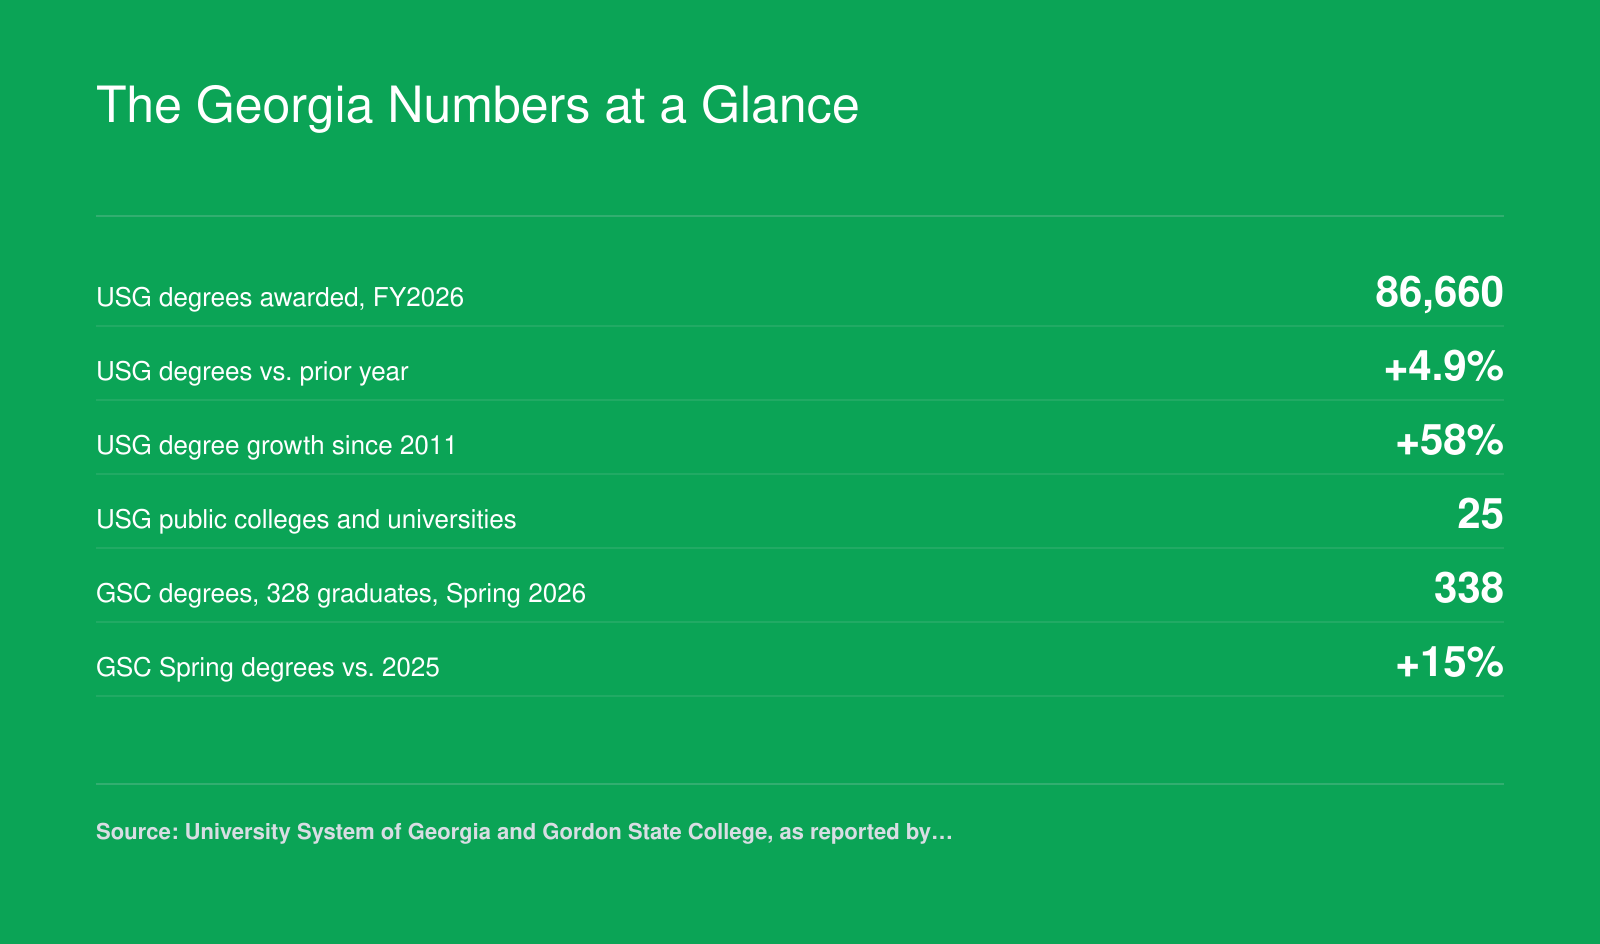
The Georgia Numbers at a Glance
These six figures show how Georgia's public university system and one of its colleges reported their 2026 results. Every figure is a degree count or a growth percentage, not a completion rate, so none of them tell you what share of entering or returning students actually finished. Use them as context for the questions you ask a school, not as a measure of your own odds of graduating.
Where to Find Your State's Adult Learner and Completion Data
A national headline gives you a trend, while a state or institution dashboard gives you something you can act on. Work through three source types in this order, because each one narrows the picture.
National Student Clearinghouse Research Center
The NSC Research Center publishes the Completing College reports and state supplements. Search "NSC Research Center Completing College" and open the state supplements page. These track students who entered postsecondary education for the first time in a given fall, then report completion at six years (and in national reports, up to eight). The state supplements have used cohorts such as fall 2012 entrants in the 2019 edition. The cited descriptions do not show adult or part-time students broken out, so treat these as a baseline, not an adult learner rate.
Your State Agency or System Dashboard
Search your state's higher-education agency or public system name plus "data dashboard" or "institutional research." For Georgia, that means the University System of Georgia. Dashboards vary widely. Some report degrees conferred, others report graduation rates, and some split out age or part-time status. Confirm each of those details on the page itself; the current Georgia dashboard's reporting could not be verified.
Federal Tools: IPEDS and College Scorecard
IPEDS is the federal institution-level data system, covering enrollment, completions, and graduation rates. Its traditional graduation rate follows full-time, first-time students, which can miss many returning adults. College Scorecard (collegescorecard.ed.gov, with a downloadable College Scorecard data dictionary) reports completion within 100% and 150% of expected time, plus a 200% measure.1 It also offers pooled outcome measures for part-time and non-first-time entering students.1 Those cohorts are useful proxies for adults, but they do not capture every adult student, and Scorecard has no metric labeled adult.
Mind the Data Lag
Completion figures trail enrollment by years. A 2026 report on six-year outcomes may describe students who started in 2019 or earlier, before many current programs, prices, and online options existed.
Quick tip: before quoting any number, find the footnote that defines the cohort (who entered, and when) and the completion window (how long they had to finish).
- College Scorecard Institution Data DocumentationU.S. Department of Education (College Scorecard)
Which States Lead on Adult Completion, and How to Benchmark Against the National Average
A state that looks strong on completion may still be a weak guide for someone returning at 30 or 40, because the headline number usually blends every kind of student. Start with the national anchors, then decide how far a state figure can take you.
The National Benchmarks
The National Student Clearinghouse Research Center's Signature Report 12 State Supplement tracks the fall 2019 entering cohort for six years. Of all students, 61.1% completed a credential. Among those who started at age 25 or older, the figure was 36.6%. An earlier cohort, fall 2018, showed 37.8% for adult starters, a drop of 0.7 percentage points from the cohort before it. Those are different cohorts, so do not mix them in one comparison.
Which States Lead and Lag
The sources reviewed here do not publish a consistent state-by-state ranking for students who started at 25 or older, so any list of the best states for adult completion would be invented. What exists is overall state rates. In the fall 2018 cohort, Rhode Island led at 72.2% and Alaska was at 35.1%, according to the Signature Report 6. Those figures cover all students, not adults. No Georgia-specific adult rate was found either. Read a state's overall rate as context, then expect the adult figure to sit well below it, as it does nationally.
Residence, Transfers and Sector
NSC state rates are typically tied to the state of the starting institution, not where the student lives. Someone who enrolls out of state, or who transfers across state lines, may be counted in a way that does not match their own path. Rates also shift with cohort year, sector (public two-year, public four-year, private nonprofit, for-profit) and enrollment intensity, since part-time students finish at lower rates than full-time peers. A state heavy in community colleges can look low or high depending on which sector you isolate.
A Three-Step Benchmarking Habit
- Same cohort year: Compare fall 2019 to fall 2019, never to an older report.
- Same sector: Set a public two-year rate against other public two-year rates, not against private nonprofit four-year figures.
- Same age group: Use the 25-and-older rate when it exists, and treat an all-student rate as a ceiling, not a forecast.
Some College, No Degree: What Re-Enrollment Data Says About Finishing
"Some college, no credential" describes adults who earned college credit at some point, left without a degree or certificate, and are not currently enrolled anywhere. The National Student Clearinghouse Research Center tracks this group nationally and state by state, and its 2025 snapshot1 (covering the 2023-24 year) is the closest thing you have to a map of how often people in your situation go back and finish.
What the National Numbers Show
In 2023-24, more than a million of these students re-enrolled, a record number of students re-enroll in college, an increase of about 66,000 people, or 7.0 percent, over the prior year. That still works out to a re-enrollment rate of 2.7 percent of the overall population, up a tenth of a point. Forty-two states and the District of Columbia posted increases, with Massachusetts recording the largest at 35.2 percent. A re-enrollee here simply means someone from that stopped-out population who showed up in enrollment records again, not someone who graduated. Finishing is a separate count: 4.7 percent of re-enrollees earned a credential in their first year back, and 14.1 percent within two years.1 Persistence matters too. Of roughly 901,000 who came back in 2022-23 without earning anything that year, 58.7 percent returned again the next year.
Who Tends to Finish
- Prior credits help most. The report flags "potential completers," meaning students with at least two years of full-time-equivalent credit in the past decade. They make up about 7.2 percent of the population, roughly 2.7 million people; their re-enrollment rate was 7.2 percent compared with 2.3 percent for everyone else, and their first-year credential rate was 8.4 percent compared with 2.3 percent.1
- Recent stop-outs were more likely to re-enroll than people who left long ago, and more likely to return to their former institution rather than transfer.
Turn That Into Action
Order official transcripts from every school you attended, then ask each prospective college how many of those credits transfer and whether any expire. Ask specifically about credit recovery for old failing or incomplete grades, prior learning assessment, and whether a dedicated degree-completion track exists.
One caution: state figures tell you how large the returning-adult population is and how the trend is moving. They say nothing about how a particular college treats the adults who walk through its door.
Look up your own state's table before you assume the national pattern applies locally.
- Some College, No Credential: A 2025 Snapshot for the Nation and StatesERIC (Institute of Education Sciences)
Where Completion Becomes a Paycheck: Three Gordon State on-Ramps
These Gordon State College pathways are examples of what to look for at any school, not an endorsement. Each one links finishing a degree to lower cost, paid training, or a job, but only one has fully published terms. Use the last column as your list of questions before you commit.
| On-ramp | Who it suits | What it costs or pays | How it ties to a job | What to verify |
|---|---|---|---|---|
| Under-$20,000 four-year degree | Students, including returning adults, who want an affordable four-year bachelor's pathway | Under $20,000 in total tuition for four years (total, not per year). Fees and housing are not included. | No employer commitment is attached. The benefit is a lower tuition bill on the way to a credential. | Price fees and housing separately. Ask how transfer credits change the total, since the figure assumes a full four-year path. |
| GaRTAP teacher apprenticeship | Unconfirmed. The available sources do not publish eligibility or target participants. Gordon State is Georgia's No. 1 institution for registered teaching apprentices. | Unconfirmed. No apprenticeship pay or scholarship amount is stated in the available sources. | Teacher preparation through a registered apprenticeship. Gordon State's education program produced 204 graduates over three years, serving more than 40 Georgia counties. | Ask about apprenticeship structure, wages while training, eligibility, the employing school district's commitment, and which degree programs participate. |
| Upson Regional Medical Center nursing scholarship | Selected Gordon State nursing students who plan to work as registered nurses in Georgia | URMC plans to award 10 students $2,500 per semester, paid directly to the college for eligible costs such as tuition, mandatory fees, and books | Recipients may move into full-time nursing jobs at URMC after graduating and earning Georgia RN licensure | Recipients commit to 24 months of full-time URMC staff-nurse work, or six months per semester funded. Ask about selection criteria and repayment terms if you leave early or do not pass licensure. |
- MOVE FORWARD. Gordon State College ViewbookGordon State College
- Gordon State College Reflects Statewide Growth in Degree CompletionGordon State College
- Gordon State College, Upson Regional Medical Center Create Nursing Scholarship-to-Career PathwayGordon State College
How to Compare Program Completion Rates Fairly
Start With the Right Rate
Many published completion figures use the federal IPEDS graduation rate.1 That number follows first-time, full-time students who started at the same college and measures completion within 150% of normal time: six years for a bachelor's, three for an associate degree.2 It excludes part-time entrants and transfer-in students.1 If you are returning with prior credits or attending part-time, that rate may not describe your path.
IPEDS Outcome Measures is broader.3 It counts all entering undergraduates during a full academic year, first-time and non-first-time (transfer-in) students, whether full-time or part-time, and reports outcomes at four, six, and eight years.4 For adult learners, this is usually the more relevant federal measure. National Student Clearinghouse six-year rates follow students across institutions, so a transfer that ends in a degree still counts. Unlike the IPEDS graduation rate, NSC figures are not limited to the college where a student first enrolled. Use those two when you have prior college credits or interrupted attendance.
Ask What Is in the Denominator
Before trusting any number, ask: Who was in the starting group? Were part-time students included? Were transfer-in students included? Does the figure count the same credential level, bachelor's to bachelor's, associate to associate? What is the starting term, and how long did the cohort have to finish? A program with mostly older, part-time, or transfer-heavy students should not be judged on a four-year yardstick. A six-year or eight-year window is more realistic.
Watch Time and Mode
Time-to-degree differs for online and on-campus students, and for students who stop out. An online program full of working adults may show lower four-year rates but stronger six-year or eight-year completion. Online learners often enroll part-time and take longer, so compare online with online, on-campus with on-campus.
Use Two Sources Side by Side
A single rate is easy to misread. Put at least two measures next to each other: the IPEDS Outcome Measures number for transfer-in or part-time students and an NSC six-year or eight-year rate. If both point the same direction, you can trust it more. Compare like with like, and ask the program for its own stated denominator.
Every degree earned at Gordon State represents a student prepared to move forward.
Dr. Russell Crutchfield, President, Gordon State College
Questions to Ask Admissions Before You Re-Enroll
A record degree count tells you about a system. These questions tell you about your own odds, costs and payoff. Ask them before you pay a deposit, and ask for answers in writing.
- CompletionWhat share of students my age and enrollment status finish this program, and in what time window? Ask specifically about part-time and returning adults, not first-time, full-time freshmen, and ask whether the figure covers four, six or eight years.
- CreditsHow many of my prior credits will transfer, and which requirements will they satisfy? Request an official credit evaluation in writing before you commit money, so you know exactly how many courses stand between you and the degree.
- CostWhat are the total tuition and fees to finish from where I am now, after grants and aid? A headline figure, such as Gordon State's under-$20,000 total tuition for a four-year degree, is a starting point. Your own remaining cost is the number that matters.
- JobsWhat do graduates of this program earn, and what employer partnerships or apprenticeships exist? Look for concrete links, such as paid teacher apprenticeships or a hospital partnership that offers a job after licensure.
- SupportIs there a dedicated advisor for returning adults? Are required courses offered in the evening, online or part-time, every term, so a work schedule doesn't stall your progress?
Red Flags in Completion Marketing
Completion marketing often cites numbers that look like proof but lack the context needed to make a decision. A "record number of graduates" sounds impressive, but it does not tell you how many students started the program and finished it. A large graduating class can hide a low completion rate if far more students dropped out along the way.
Raw Counts Without a Rate
If an ad says the school awarded "the most degrees in its history," ask for the denominator. Completion should compare finishers to the number of students who began the same program or cohort. Without that, record growth may simply reflect a larger starting class, not better support for returning adult students.
Mixed Credentials in One Headline
Watch for certificates, associate degrees, and bachelor's degrees pooled into a single completion number. These credentials take different lengths of time and lead to different labor market outcomes. Combining them can inflate the headline while hiding weak results in the particular program you are considering.
Cherry-Picked Cohorts and Vague "up to" Claims
Be cautious when a school highlights one exceptional year, full-time students only, or a single hand-picked program. Ask whether the figure reflects part-time adult learners, transfer students, and students who stopped out and later returned. Phrases like "save up to," "finish in as little as," or "up to 90% completion" are also red flags unless the school can state the typical or median result. A median tells you what the middle student experiences, not the best possible case.
Say This Back to the Recruiter
"Can you tell me how many adult students started this program in a given year, what share finished within the typical time window, and which credential types are included in that share? And can you give me the median result, not the best-case figure?"